CPU and GPU
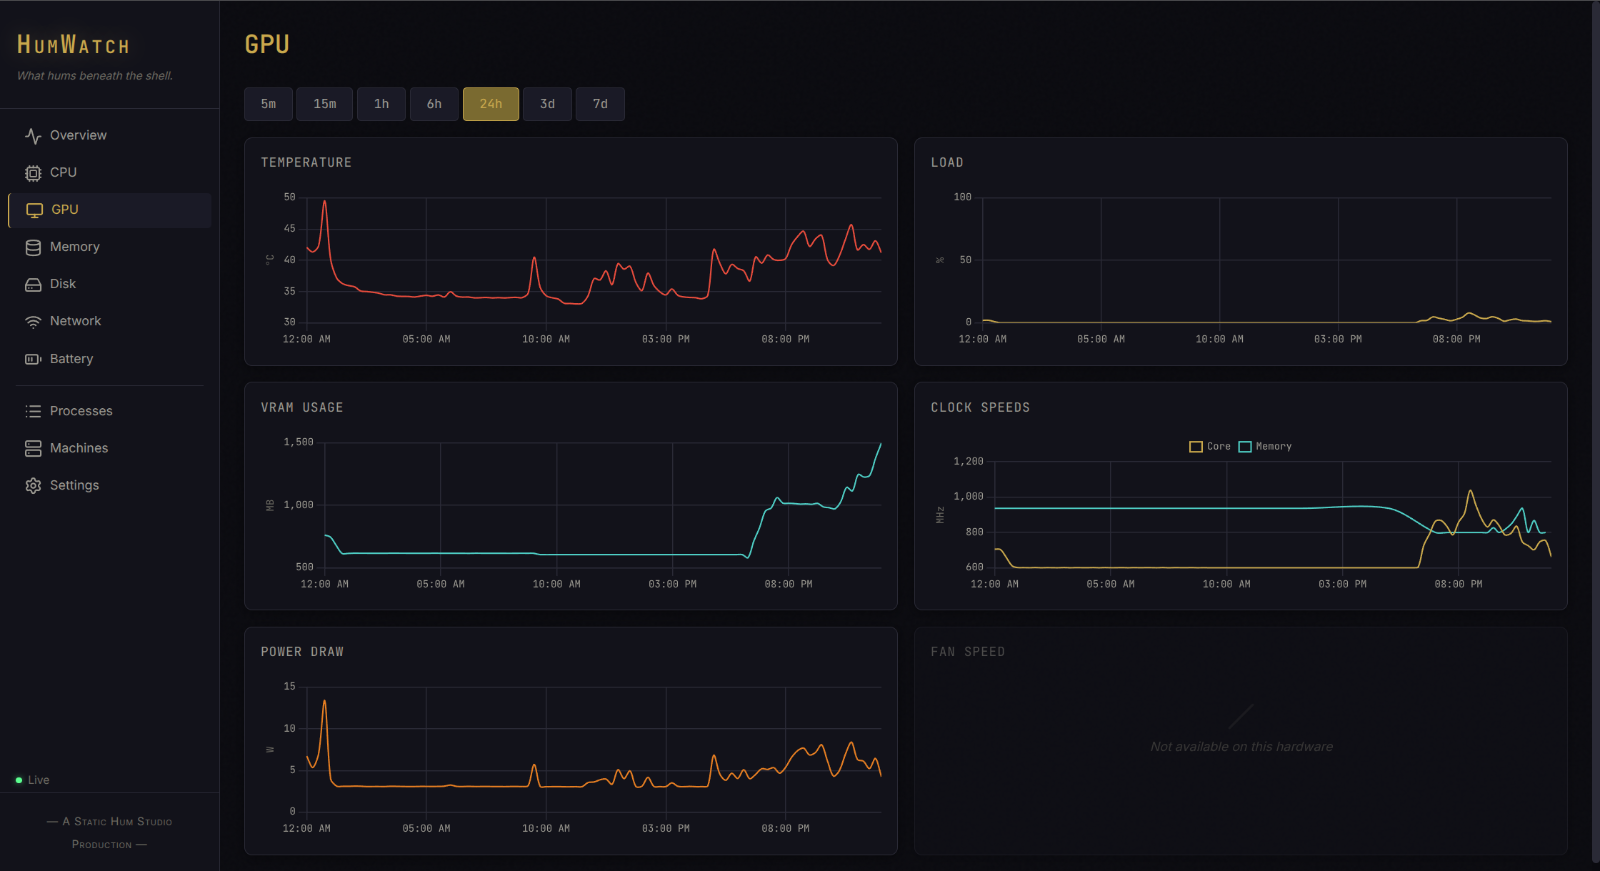
Load, clocks, temperatures, power, video memory, and fans when the hardware exposes them.
HumWatch
A self-hosted browser dashboard for the Windows and Linux computers around you. Watch the temperatures, load, memory, disks, fans, battery, and other useful signs without sending the readings into someone else’s cloud.
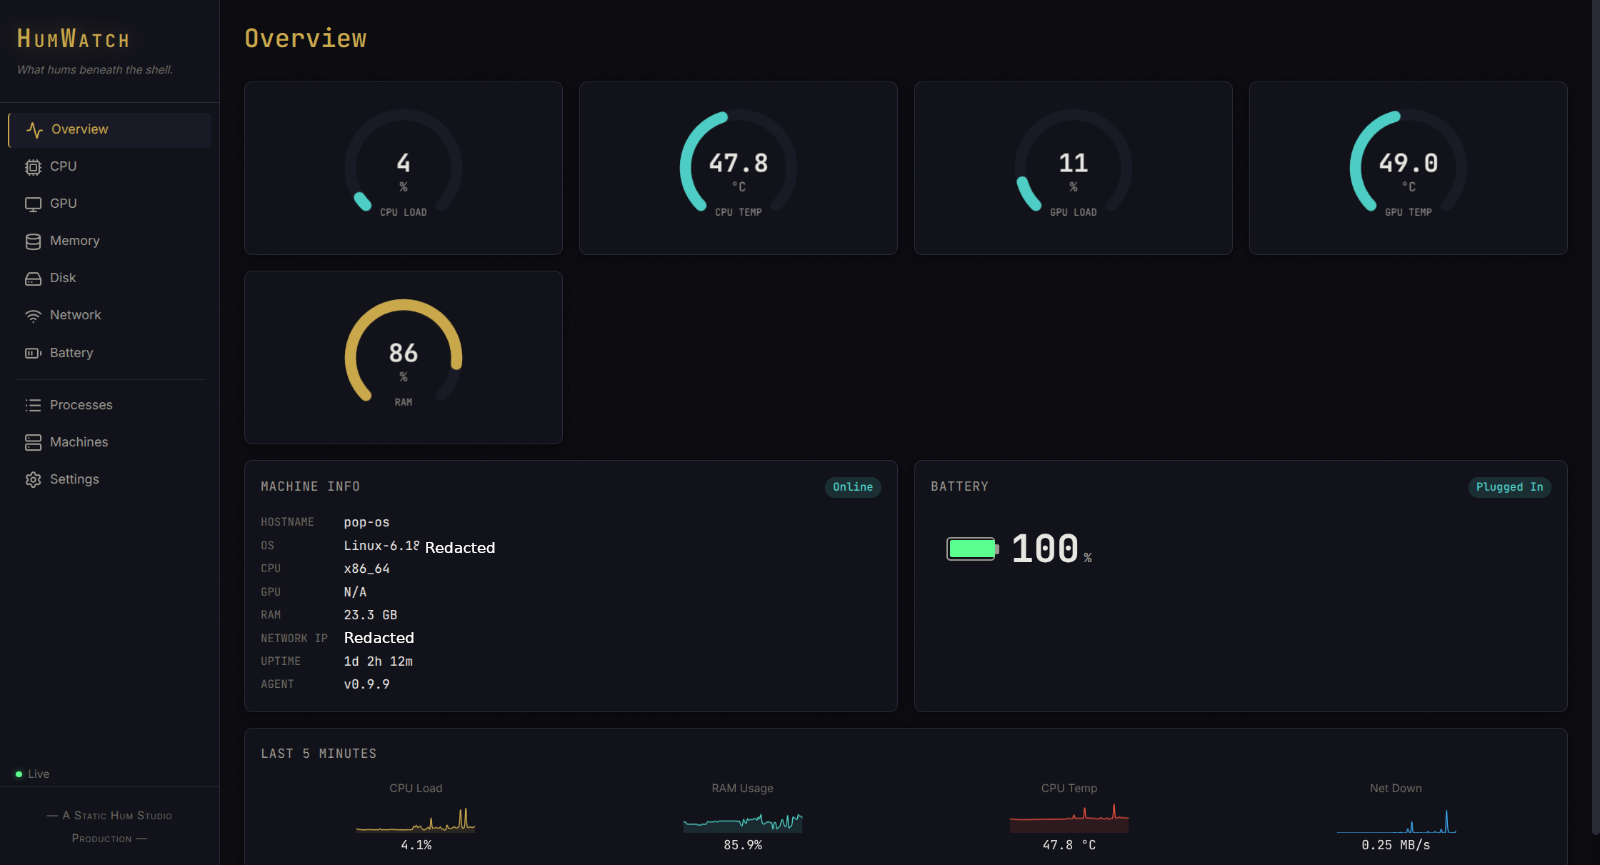
HumWatch is a self-hosted hardware monitor for people running their own Windows or Linux machines, showing CPU, GPU, memory, and other readings in a browser dashboard served by the machine itself. It has working release builds for both platforms, but the repository and downloads are private right now, so the public cannot get it yet.
When the fan suddenly has opinions
HumWatch is for the computers you care about personally. It helps answer “what is this box doing?” without pretending to replace a data center monitoring stack.
Load, clocks, temperatures, power, video memory, and fans when the hardware exposes them.
RAM, swap, storage use, read and write activity, and the processes taking the biggest bite.
Transfer rates, cumulative traffic, charge level, health, rate, and voltage where available.
A moment is useful. A pattern is better.
Readings roll into a database on the machine and age out after seven days. The dashboard can show the spike that already passed, not only whatever the sensor happens to say right now.
Real dashboard, real readings
One machine first
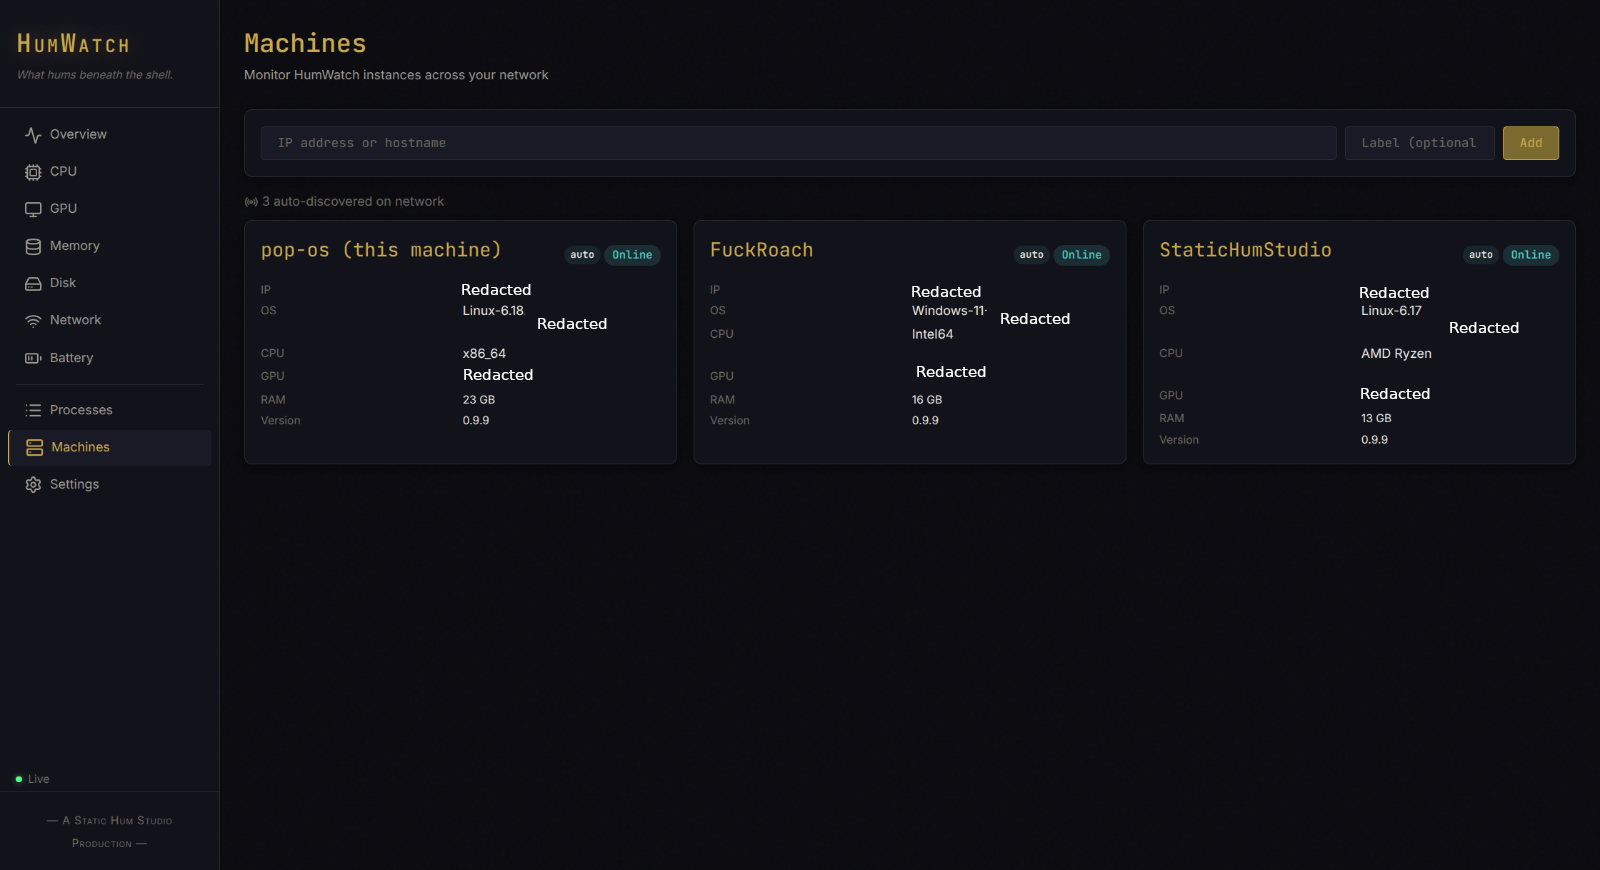
Each HumWatch machine serves its own dashboard. You can add other instances to a machines view and reach them over the LAN or private network you already run. Nothing requires a central HumWatch cloud account.
Local does not mean careless
Current HumWatch builds require HTTPS and a bearer token, including development setup. The telemetry database stays on the machine. There is no HumWatch account and no hosted service receiving the readings.
Different machines, different sensors
Basic readings work through the bundled system layer. Advanced temperatures, voltages, fans, and GPU details use LibreHardwareMonitor, with PawnIO needed for full sensor access.
HumWatch reads the hardware and process information Linux exposes through its normal system interfaces. Available detail depends on the machine and drivers.
Before you point it at your rig
HumWatch tracks CPU and GPU load, clocks, temperatures, and power, along with memory, disk activity, network traffic, and battery health where the hardware exposes it. Windows gets deeper sensor detail through LibreHardwareMonitor and PawnIO. Linux reads whatever its own system interfaces expose, which varies by machine and drivers.
Yes. Basic Windows readings work through the bundled system layer, with LibreHardwareMonitor and PawnIO for deeper sensors. Linux reads hardware and process information through its normal system interfaces, with the available detail depending on the machine.
On the machine being watched. Readings roll into a local SQLite database and age out after seven days, and there is no HumWatch account or hosted service receiving them.
Yes. Each HumWatch instance serves its own dashboard, and you can add other machines to a machines view and reach them over the LAN or private network you already run. Nothing requires a central HumWatch cloud account.
HumWatch is built to be reached over the LAN or private network you already run, not opened to the internet by the app itself. Current builds require HTTPS and a bearer token, including during development setup, so the dashboard is never served without a lock on it.
Working build, private door
HumWatch has working Windows and Linux release artifacts, but the repository and downloads are private today. This page will not send ordinary visitors to a GitHub door they cannot open.